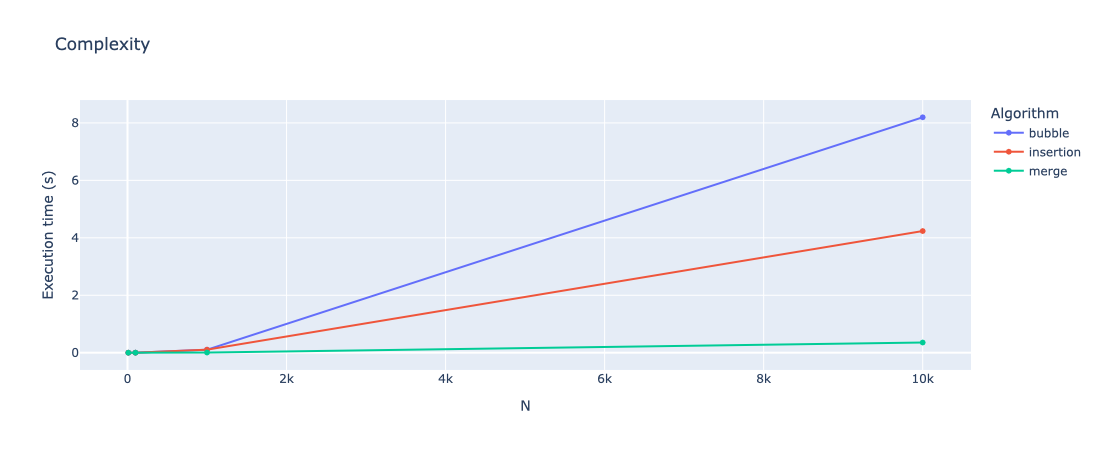
Figure specifications
The final configuration file that must be provided to the feelpp.benchmarking framework is the plot specifications file. This file contains the information necessary to generate the plots that will be displayed in the report.
It has a flexible syntax that allows users to build figures depending on the benchmark parameters.
The file should contain a single field: plots, which is a list of Plot objects.
The figures will appear in the report in the order they are defined in the file.
Users should specify the plot type and which data to use for different axis.
Additionally, a transformation field can be provided to apply a transformation to the data before plotting. For example, users can apply a speedup transformation.
|
Many plot types are supported. Some of them can take an arbitrary number of parameters by using the |
 .pdf
.pdf
