3. feelpp.benchmarking for advanced performance analysis
1. What you will learn in this course
-
How to configure feelpp.benchmarking to overcome common benchmarking challenges
-
How to create custom figures to visualize benchmarking results
-
How to create a continuous benchmarking workflow
When benchmarking applications on HPC systems, multiple challenges arise. For example,
-
how does one guarantees reproducibility of an application across different systems?
-
how to compare the performance of an application across different systems?
-
how do I handle large input datasets and memory requirements?
This course will teach you how to use feelpp.benchmarking to overcome these challenges.
2. Configuring containers in feelpp.benchmarking
A good practice for guaranteeing reproducibility of an application is to containerize it. This way, the application can be run in the same environment across different systems. feelpp.benchmarking supports the use of containers to run benchmarks.
2.1. Specifying container platforms in ReFrame system settings.
The first step to supporting containers, is to modify ReFrame’s system configuration. This can be simply done by adding the following lines to your system partition configuration:
"container_platforms":[{ "type": "Apptainer" }]Multiple container runtimes are supported:
-
Docker
-
Singularity
-
Apptainer
-
Sarus
-
Shifter
| Custom modules and environment variables can be specified in this field. |
2.2. Configuring containers in the Machine Specifications file
The next step is to configure the container settings in the machine specifications file.
feelpp.benchmarking's machine specification interface is equiped with a container field that allows you to specify common directory paths, options and some settings for executing benchmarks in containers.
containers is a dictionary containing the container runtime name as the key and the settings as value. The settings include:
-
image_base_dir: The base directory where the container images are stored, or will be stored. -
options: A list of options to pass to the container execution command. -
executable: If the command used for pulling images is different from the default, it can be specified here. -
cachedir: The directory where the container cache is stored. -
tmpdir: The directory where container temporary files are stored.
At the moment, only the apptainer container is supported. Support for other container runtimes will be added in future releases.
|
2.3. Configuring containers in the Benchmark Specification file
Concerning the benchmark specification file, the container settings are specified in the platform field.
This field will containg all possible platform configurations, including the built-in (local). However, it is the machine configuration file that will determine where tests will be executed, by specifying it in the targets field.
Let’s break down the platforms field:
-
apptainer: The container runtime name. Must match the name specified in the machine configuration file. -
image: The image field contains the path where the container image can, or will be, be found. If the URL is specified, the image will be pulled and stored infilepath. -
input_dir: The directory where input data is stored in the container. -
options: A list of options to pass to the container execution command. -
append_app_option: A list of options to append to the application command. This allows customizing the application execution depending on the platform.
| Image pulling will be done ONCE, and usually from a head node. |
3. Remote Input Files
It is possible to download input files for your application from a remote location. This is useful when input files are not yet available on the system where the benchmark is executed, and for users to not have to manually upload the files.
To use remote input files, you can use the remote_input_dependencies field in the Benchmark Specification file.
The remote_input_dependencies field is a dictionary containing a custom name as the key and a RemoteData object as a value.
The RemoteData object can be constructed using the following syntax:
{
    // File, folder or item
    "my_data_management_platform": { "file": "my_id" },
    // The path to download the files to
    "destination": "/path/to/destination"
}Finally, the destination path can be accessed by other fields using the {{remote_input_dependencies.my_input_file.destination}} syntax.
4. Input File Dependencies
The feelpp.benchmarking framework allows you to specify input file dependencies in the Benchmark Specification file. This is notably useful to impose validation checks on the input files before running the benchmark.
Additionally, this field can be used to handle data transfer between different disks.
For example, most HPC clusters have Large Capacity disks and High Performance disks. A common problem is that the application’s performance can be bottlenecked by the disk’s read/write speed if the input files are stored on the Large Capacity disk. In this case, you can use the input_file_dependencies field to copy the input files to the High Performance disk before running the benchmark, and delete them after the benchmark is completed so that the High Performance disk does not become cluttered.
4.1. How to specify file dependencies
The input_file_dependencies field is a dictionary containing a custom name as the key and an absolute or relative path to the file as the value.
However, this field is highly dependent on a special field on the Machine Specification file: input_user_dir.
-
If this field is not specified and the filepaths are relative, they are relative to
machine.input_dataset_base_dir. -
If this field is specified, the filepaths should be relative to
machine.input_user_dir, and they will be copied frommachine.input_user_dirtomachine.input_dataset_base_dirkeeping the same directory structure.
| The existance of all file dependencies will be verified. |
Parameters can be used in the input_file_dependencies field for refactoring.
|
5. Custom Performance Variables
Custom performance variables can be created by performing operations on existing ones. This can be done in the feelpp.benchmarking framework by specifying a custom performance variable in the Benchmark Specification file.
The custom_varialbes field should be added on the scalability section. This field should contain a list of dictionaries, each dictionary containing the following fields:
-
name: The given name of the custom performance variable. -
operation: The operation to be performed on the existing performance variables. (available operations:sum,mean,max,min). -
columns: The list of performance variables to be used in the operation. -
unit: The unit of the custom performance variable.
| Custom variables can be used in other custom variables. Recursion is allowed. |
| Variables from different files (stages) can be aggregated in the same custom variable. |
6. Memory management
feelpp.benchmarking supports specifying the total memory required by your application under the resources field. Using the system’s available memory per node, the framework will ensure that the necessary resources are allocated for each test to run.
The system’s available memory per node should be specified in ReFrame’s System settings file, in GB, under an extra.memory_per_node field the partition configuration.
6.1. Specifying memory in resources
If the memory requirements by your application are independent of the specified parameter space, users can simply specify the memory requirements (in GB) in the resources field of the Benchmark Specification file.
| Specify a little less memory than the available memory per node to avoid swapping. |
7. Website persistance and aggregating results
The framework allows users to create a dashboard that aggregates results from multiple benchmarks. This is useful for comparing different machines, applications, or use cases.
7.1. The dashboard configuration file
Whenever a benchmark is done, a file called website_config.json is created inside the directory specified under reports_base_dir on the machine specification file.
If this file already exists from a previous benchmark, it will be updated to include the latest results. For example, when a benchmark runs on a new system.
This file describes the dashboard hierarchy and where to find the benchmark results for each case/machine/application.
Each website configuration file corresponds exactly to one dashboard, so users can have multiple dashboards by defining multiple website configuration files.
The file is structured as follows:
{
"execution_mapping":{
    "my_application":{
        "my_machine":{
            "my_usecase": {
                "platform": "local", //Or "girder"
                "path": "./path/to/use_case/results" //Directory containing reports for a single machine-application-usecase combination
            }
        }
    }
},
"machines":{
    "my_machine":{
        "display_name": "My Machine",
        "description": "A description of the machine",
    }
},
"applications":{
    "my_application":{
        "display_name": "My Application",
        "description": "A description of the application",
        "main_variables":[] //Used for aggregations
    }
},
"use_cases":{
    "my_usecase":{
        "display_name": "My Use Case",
        "description": "A description of the use case",
    }
}

}
The execution_mapping field describes the hierarchy of the dashboard. That is, which applications where run on which machines and for which use cases. The path field supports having reports stored on remote locations, such as Girder.
The machines, applications, and use_cases fields define the display names and descriptions for each machine, application, and use case, respectively.
7.2. Aggregating results
If our benchmarks contain more than 2 parameters, it can be difficult to visualize results on a single figure. The framework allows users to aggregate results by reducing the number of dimensions in the data. In addition, the framework indexes reports based on their date, the system they where executed on, the platform and environment, as well as the application and use case benchmarked.
7.2.1. The aggregations field on Figure Specifications
In order to aggregate data (and reduce the number of dimensions), the aggregations field can be used on the figure specification file. This field is a list of dictionaries, each containing the fields column and agg, describing the column/parameter to aggregate and the operation to perform, respectively.
Available aggregation operations are:
-
mean: The mean of the values -
sum: The sum of the values -
min: The minimum value -
max: The maximum value -
filter:value: Filters the data based on the value of the column
7.2.2. Overview configuration file
It is possible to create overview pages that show the performance of a group of benchmarks. This is useful for comparing different machines, applications, or use cases.
Each perforamnce value, for all reports, is indexed by:
-
The parameter space
-
The variable name
-
The benchmark date
-
The system where the benchmark was executed
-
The platform where the benchmark was executed
-
The environment where the benchmark was executed
-
The application
-
The use case
Depending on the dashboard page you are located, benchmarks are filtered by default. For example, if you are in the machine page, only benchmarks for that machine will be shown.
Accessible column names:
-
environment
-
platform
-
result
-
machine
-
usecase
-
date
The dashboard administrator can define the overview configuration file, which is a JSON file that describes the figures to be displayed on each overview page.
This overview configuration file is currently too extensive and verbose and needs to be simplified, so it will not be treated in this course. However, be aware that it is possible to create overview pages that show the performance of a group of benchmarks.
8. Continuous benchmarking
It is possible to configure a workflow for feelpp.benchmarking to continuously benchmark an application. This will allow users to:
-
Centralize benchmark results in a dashboard
-
Connect the CB pipeline to an existing CI pipeline
-
Ensure non-regression and analyse the performance over time
-
Compare the performance of different versions of the application
8.1. Launching a benchmark
Currently, the workflow is not directly available from feelpp.benchmarking. However, a template repository is coming soon to help users set up the workflow.
In order to have this workflow running, self-hosted runners for your machines are required. And one "default" runner is needed to orchestrate launching the application on different machines.

-
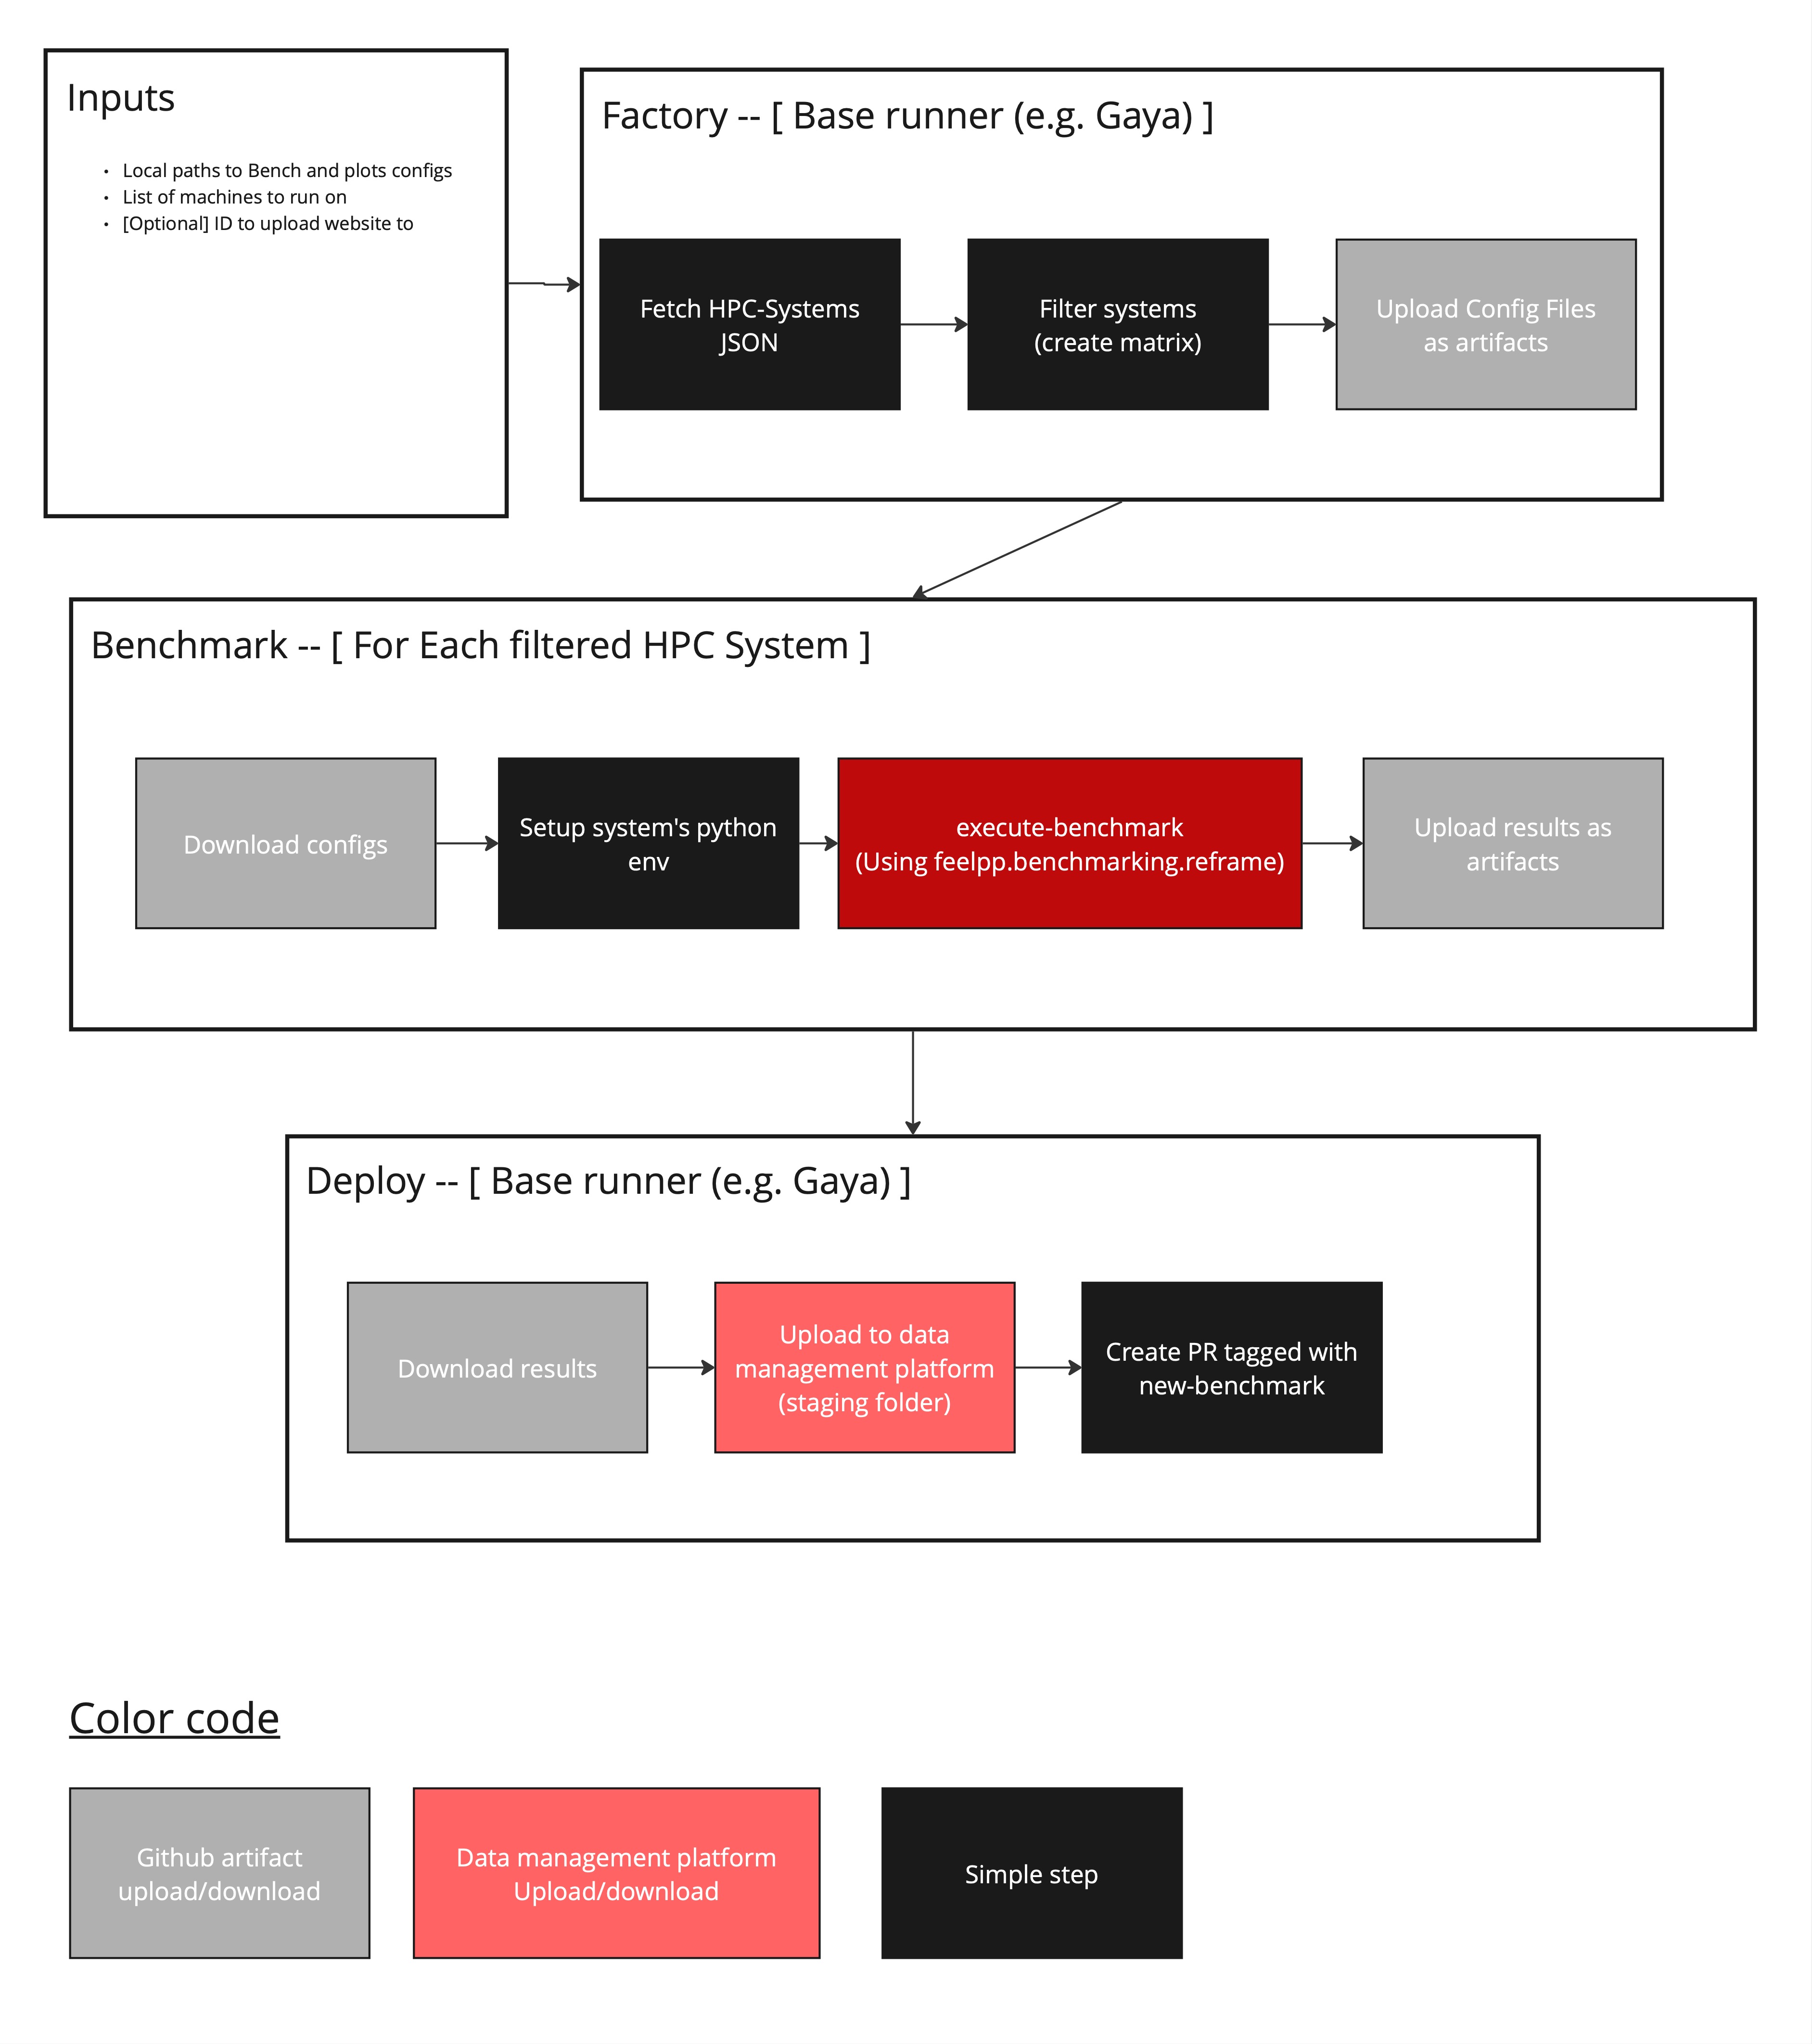
The workflow takes as input: the benchmark configurations paths, a list of machines to run, and optionally a Girder ID to updload the website to (more data management platorms will be supported in the future).
-
In a default runner (can even be a GitHub hosted runner), machine specification files are read and filtered by the given machine name list input. This allows to launch the application on multiple machines. Then, a "Matrix" is created to later tell the workflow what runners to launch.
-
Then, only desired machine configurations are uploaded as GitHub artifacts.
-
On each HPC system, the machine configuration is downloaded.
-
A Python environment is then set up, depending on the system. (e.g. loading necessary modules, creating the python virtual environment, downloading
feelpp-benchmarking). -
feelpp.benchmarking launches all parametrized tests using the
feelpp-benchmarking-execcommand. -
When benchmarks are done, results are uploaded as GitHub artifacts in order to communicate them with the default runner.
-
The default runner then collects all results and uploads them to the data management platform.
-
If a custom remote ID is provided to upload the dashboard to, the dashboard is uploaded to the data management platform. Otherwise, a pull request tagged with
new-benchmarkis created to preview the results. We do the preview with Netlify.
|
This workflow requires setting up the Girder data management platform so that it contains to following folders: |
8.2. Deploying the dashboard
GitHub pages can be configured to have a persistent dashboard containing benchmarks. But we want to have only pertinent benchmarks on this publicly available dashboard. To do so, the following workflow is proposed.

-
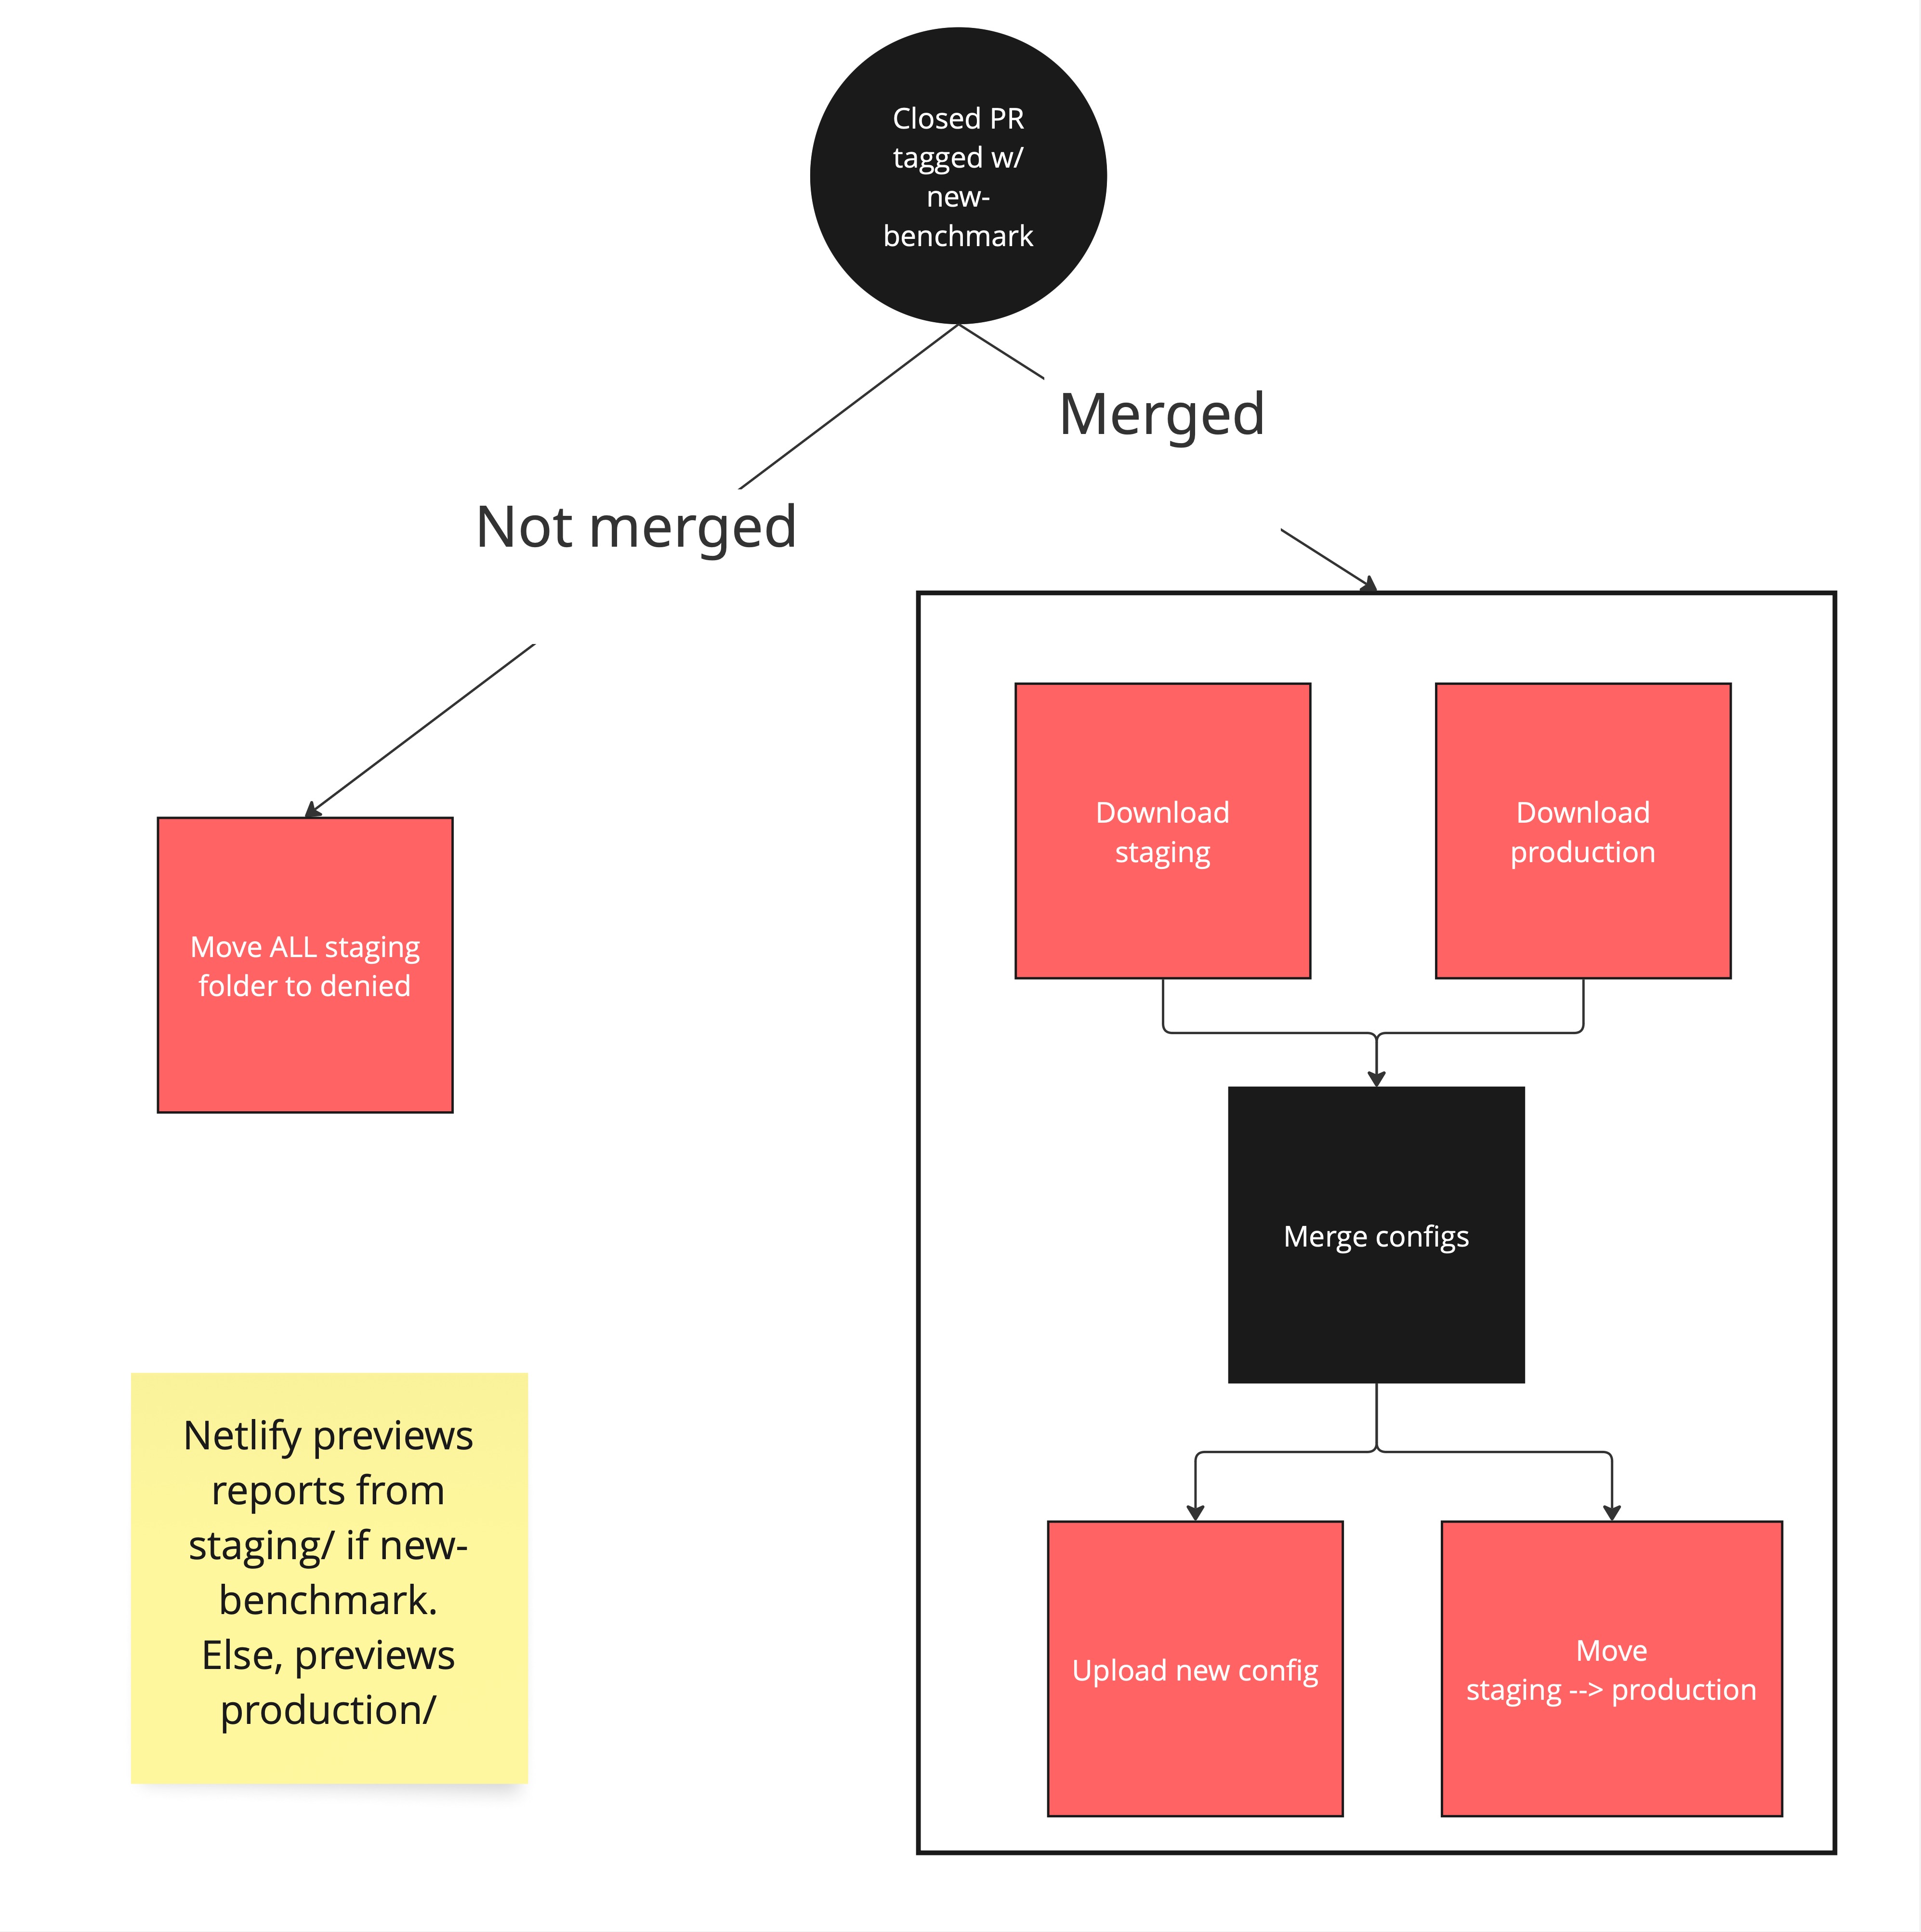
When a pull request tagged with
new-benchmarkis closed, the deploy.yml workflow is launched. -
If the pull request is closed, all benchmarks present on the
staging/folder are moved to thedeniedfolder (on the data management platform). -
If the pull request is merged, staging and production dashboard configuration files are downloaded.
-
Both configuration files are merged, so that staging benchmarks are added to the production dashboard.
-
The new dashboard configuration is uploaded, and staging benchmarks are moved to production.
-
This will trigger the GitHub pages deployment, having all production benchmarks.
9. Wrap-up and Q&A
feelpp.benchmarking just recently made its first release. It is still under development and many features are still being added and improved. Contribution and feature requests are more than welcome on this open-source project. Check out the GitHub repository.
-
Questions?
-
Suggestions? Feedback?
-
Star the project on GitHub!
 .pdf
.pdf
